Market Analysis By FXOpen
-
Nasdaq-100 Price Hits All-time High after 4 Straight Months of Gains
The Nasdaq-100 index is holding above 18,000 today following yesterday's bullish momentum, fueled by inflation news.
The PCE consumer spending index amounted to 0.4% on a monthly basis, which was in line with analysts' expectations. A year ago, we recall, it was 0.6%. Thus, statistics indicate a weakening of inflation which means that the likelihood of the Fed cutting interest rates increases — the anticipation of this event increases optimism in the stock market.
Another driver is the strong price action of NVDA stock. The company's capitalization is close to USD 2 trillion, as Nvidia is perhaps the main beneficiary of the AI boom — NVDA's price rose approximately 28% in February.
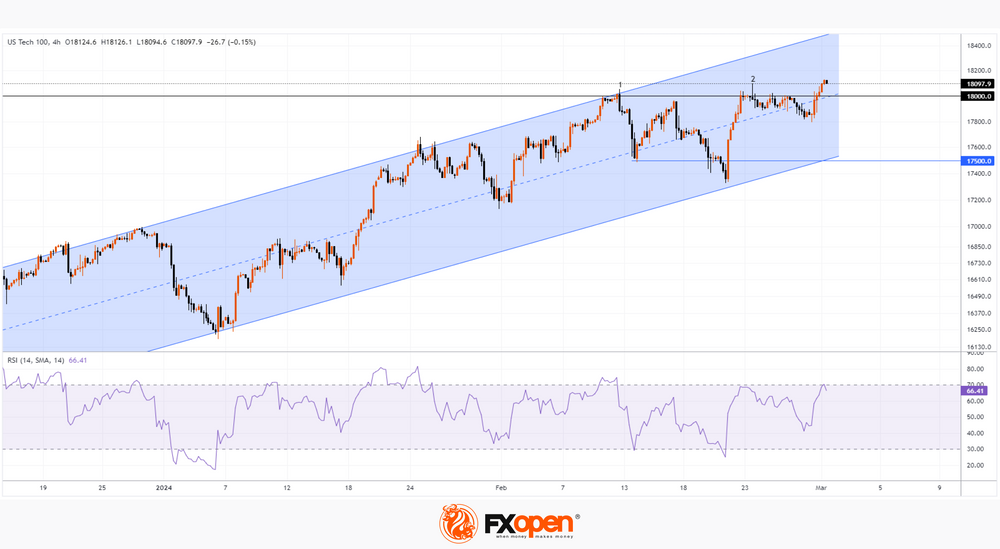
The Nasdaq-100 chart shows that the index price has been in an upward trend since the beginning of 2024 (shown by the blue channel):
→ with the price is in its upper half;
→ from the point of view of technical analysis of the Nasdsaq-100, the level of 18k points, which acted as resistance in February, may support the market in March — however, this is if the bulls manage to gain a foothold above 18,000.In the meantime, the current exceeding of maximum 2 looks insignificant. And this creates the threat of a false bullish breakout — as an example, this turned out to be the maximum 2, when the price exceeded the maximum 1. Let's note another bearish factor, the overbought state on the RSI indicator.
VIEW FULL ANALYSIS VISIT - FXOpen Blog...
Disclaimer: This article represents the opinion of the Companies operating under the FXOpen brand only (excluding FXOpen EU). It is not to be construed as an offer, solicitation, or recommendation with respect to products and services provided by the Companies operating under the FXOpen brand, nor is it to be considered financial advice.
-
Price of Gold Briefly Exceeded $2,050 per Ounce

In addition to new records in the stock markets, the reaction to yesterday's news about inflation in the US was also a decrease in government bond yields and a rapid rise in the price of gold — the cost of XAU/USD jumped by 0.9% in just one hour, while the day's high exceeded USD 2,050 per ounce .
However, on Friday morning the price of XAU/USD dropped below USD 2,040 – did market participants misjudge the impact of US inflation on the price of gold?
XAU/USD chart shows that:
→ the price of gold is in a downward trend (shown in red);
→ yesterday, the price not only touched the psychological level of USD 2,050, but also reached the upper limit of the downward red channel. That is, both lines acted as a block of resistance, which appears to be a serious obstacle to the upward impulse (shown by blue lines).A sharp change in sentiment (yesterday, positive, today, negative) may be similar to a sharp change in mood (in a mirror image) that happened in mid-February. As the blue arrows show, the negativity caused by the price falling below the psychological level of USD 2,000 within a few days was replaced by positive sentiment.
Therefore, it is possible that the activation of the bears, noticeable in the action of the price of gold this morning, may result in an attempt to resume the development of the market trend within the red channel. The nearest serious test of the seriousness of the bears' intentions may be the lower blue line, which worked as support in the second half of February.
VIEW FULL ANALYSIS VISIT - FXOpen Blog...
Disclaimer: This article represents the opinion of the Companies operating under the FXOpen brand only (excluding FXOpen EU). It is not to be construed as an offer, solicitation, or recommendation with respect to products and services provided by the Companies operating under the FXOpen brand, nor is it to be considered financial advice.
-
WTI Oil Price Reaches 4-month High against the Backdrop of OPEC+ Decision
On Friday, the price of a barrel of WTI crude oil exceeded USD 80 per barrel due to the decision to continue the policy of reducing oil production by OPEC+ countries.
Saudi Arabia said on Sunday it would extend oil production cuts until June to “maintain stability and balance in oil markets,” an official statement said. Kuwait and the United Arab Emirates also said they would also continue cuts.
NYT writes that the decision was expected. At the same time, the price of WTI oil exceeded USD 80 per barrel on Friday for the first time since the beginning of November 2023.
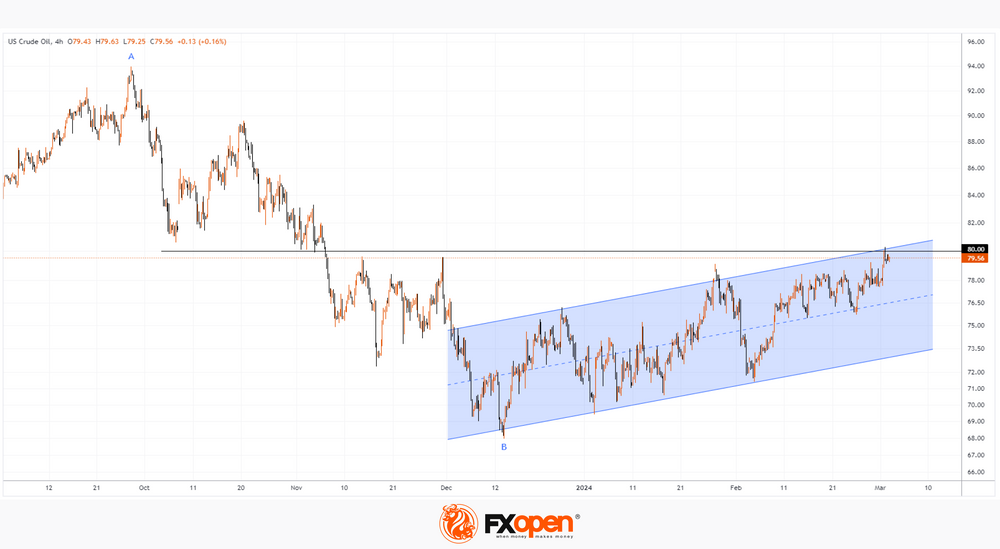
The price chart for WTI oil shows that the market has been in an upward trend since mid-December - the price has formed an upward channel (shown in blue). In addition to the OPEC+ policy, the strength of demand is also supported by:
→ uncertainty in the military conflict between Hamas and Israel;
→ facts of attacks on oil tankers in the Red Sea.Will the price be able to consolidate at the peak reached? Arguments against the development of such a scenario are provided by a technical analysis of the WTI oil price chart:
→ the price is at the upper border of the ascending blue channel (that is, near the resistance line);
→ the USD 80 level can act as psychological resistance with the formation of a false breakout pattern;
→ the top formed on Friday is in the resistance area of the Fibonacci level of 50% of the decline A→B.VIEW FULL ANALYSIS VISIT - FXOpen Blog...
Disclaimer: This article represents the opinion of the Companies operating under the FXOpen brand only (excluding FXOpen EU). It is not to be construed as an offer, solicitation, or recommendation with respect to products and services provided by the Companies operating under the FXOpen brand, nor is it to be considered financial advice.
-
5 Stocks To Consider in March 2024

Here we are, beginning the last month of the first quarter of 2024, which has passed by in somewhat of a flash.
Perhaps the apparent speed at which the spring is approaching can be attributed to what appears to be a single issue among analysts and market participants since the beginning of the year, that being the anticipation of announcements by central banks in Western countries with regard to monetary policy. Put simply, is the rate of interest going down?
Rather interestingly, it did not. The United States led the charge of announcements relating to monetary policy this year, and contrary to popular belief, the interest rates have not been reduced. The equities and commodities markets have had extra factors to consider, including logistical dire straits in the Red Sea, meaning products cannot reach their destination as freely as last year, and OPEC+ countries looking at production cut extensions in front of a backdrop of war in the Eastern Mediterranean region.
The markets have been somewhat volatile, which means trading activity remains interesting. Here are five interesting stocks to look at this month.
- eBay
Over the past few weeks, eBay stock has been demonstrating strong performance, with a continued overall upward direction since mid-January, with just a few blips on the way.
Last week, the e-commerce giant reported its earnings for the fourth quarter of 2023, which came to a remarkable $728 million, translating to $1.07 a share, compared with a net income figure of $671 million in the same quarter in 2022.
That led to a healthy increase in stock value. However, the real eye-catcher is what happened during the trading day on Thursday, February 28.
Suddenly, eBay stock rose from $44.32 on October 27 to $47.81 according to FXOpen charts, a considerable increase which continued to build, ending the trading day on Friday, March 1, at $47.97.
This sudden jump in value occurred a few days after the market's reaction to the positive results, and it is interesting indeed. eBay's high level of prominence in areas such as online advertising banner sales, fees from auction sales from private sellers, and premium listings from commercial sellers has led it to be the de facto marketplace for most of the world. Jumps like this are rare for such highly capitalised companies, so a keen eye will likely be on eBay's movements in the next few days.
- China Construction Bank (HK)
China Construction Bank is one of the largest banks in the world by market capitalization and is among the four largest banks in mainland China.
Its origins lie deeply rooted in state ownership, as is commonplace within the planned economy under which the People's Republic of China operates, and it was brought into being by the People's Bank of China, which is the Chinese central bank, beginning to spin off its commercial banking operations.
Considering its vastness and that it is such a vast corporation operating within the world's largest and most diversified economy, share prices within the Hong Kong-listed entity have been somewhat volatile recently.
During the course of the summer of last year, reports emerged stating that investors in the China Construction Bank (HK)'s stock had lost 13% over the past five years, clearly stating the long period of sustained losses, which are juxtaposition to the bank's massive might.
During the first few weeks of this year, China Construction Bank's Hong Kong-listed stock has been volatile, to say the least.
On January 3, the stock was trading at a low of $4.29HKD on FXOpen; however, by February 26, it had rallied to $4.95HKD before beginning to decrease again.
This is an inordinately low-value stock, which demonstrates the difference in tradability between Western banking giants and those with their origins in China. A leftfield one to look at, but interesting nonetheless.
- Coinbase
The endless news coverage about cryptocurrencies may have died down long ago, but the major digital asset exchanges are still very much alive and well.
Many of the large exchanges, such as Coinbase and Binance, got their product right in the design of intuitive trading applications, which attracted and retained a young, analytical audience. The euphoria that surrounded the cryptocurrency market in 2020 and 2021 may have ebbed away, but the extent to which many of the large exchanges went in order to provide proprietary apps that make sure they promote their brand in a way that ensures loyalty remains. Coinbase stock rocketed from $116.79 on February 5 to $208.35, according to FXOpen pricing on February 28.
That is a substantial increase in value and is without any mention of huge numbers of new crypto traders or meme boards creating their own markets, such as was the case 3 years ago.
- Lucid Group
Newly founded electric vehicle companies which have entered a somewhat conservative arena of car manufacturing often bask in the shadow of uber-disrupter Tesla, and many managed to make their way onto public stock exchanges via unorthodox SPAC listings rather than the hard slog that is years of heavy manufacturing and showing good balance sheets and economies of scale which is the way of the 140-year old motor industry's most recognised corporations. North America's Lucid Group is no exception. It is a relatively low-value stock and is a very well-established company; however, volatility has been the order of the day for some time now.
In mid-December last year, Lucid Group stock reached a sudden peak of $5.22 per share, according to FXOpen pricing, a value reached after a quick but short-lived rally. By January 19, it was down to $2.61 before heading back up to $3.50 on January 1. Since then, the share price has been erratic, to say the least.
Just two days ago, the company released its annual report, which was a damp squib. Earnings were 3.9% less than analyst estimates at US$595 million, and statutory losses were in line with analyst expectations at US$1.36 per share.
It seems there are those who believe in the new firms capitalizing on the electric vehicle revolution. However, it is hard to ignore the plethora of electric vehicles now on the market by some of the world's oldest and most established manufacturers, which are easily capable of ensuring that these new entrants could only ever be considered fringe players with an eccentric image.
- Rivian Automotive
In a rather similar vein to that of Lucid Group, electric truck manufacturer Rivian Automotive has been experiencing volatility; however, in the case of Rivian, it has been in a solid downward direction recently.
From a high point of $24.25 on December 19, Rivian stock has been plummeting, resting briefly at $15.37 on February 21 before crashing suddenly to $10.09 on February 26, according to FXOpen pricing.
VIEW FULL ANALYSIS VISIT - FXOpen Blog...
Disclaimer: This article represents the opinion of the Companies operating under the FXOpen brand only (excluding FXOpen EU). It is not to be construed as an offer, solicitation, or recommendation with respect to products and services provided by the Companies operating under the FXOpen brand, nor is it to be considered financial advice.
Modify message - eBay
-
Swiss Franc Weakens after Inflation News
Inflation in the country fell in February to its lowest level in nearly two-and-a-half years, data from Switzerland's Federal Statistical Office showed on Monday. Although consumer prices rose 1.2% compared to a year earlier, there is reason to believe that inflation is slowing down compared to the 1.3% recorded a month earlier.
Reuters writes that the Swiss National Bank has kept inflation rates within the target range since May 2023, despite rising rents, sales taxes and energy prices. And the latest news makes it more likely that the SNB will cut rates at its next meeting, scheduled for March 21.
Thus, market participants can expect a looser policy and an affordable franc — which is why the CHF has weakened against a number of currencies. For example, the EUR/CHF rate has reached its highest level since November 2023.
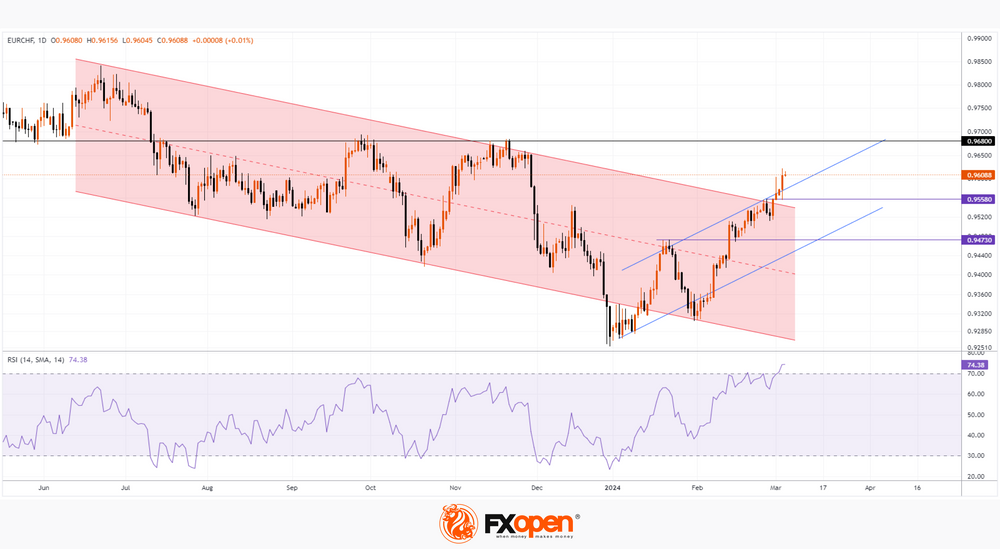
Wherein:
→ the price has broken through the downward channel (shown in red), which has been in effect since last summer — it seems that it is already losing relevance;
→ since the beginning of the year, the rate has already increased by more than 3.5%, which allows us to outline trend lines (shown in blue);
→ levels 0.94730 and 0.95580 changed their behaviour from resistance to support;
→ daily RSI indicates that after strong growth, the market is in the overbought zone, which creates the preconditions for the formation of a correction.If the growth continues, an important test of the seriousness of the bulls’ intentions may be the level of 0.96800 – near which important reversals in the EUR/CHF price were previously formed.
VIEW FULL ANALYSIS VISIT - FXOpen Blog...
Disclaimer: This article represents the opinion of the Companies operating under the FXOpen brand only (excluding FXOpen EU). It is not to be construed as an offer, solicitation, or recommendation with respect to products and services provided by the Companies operating under the FXOpen brand, nor is it to be considered financial advice.
-
The Market Focusing on Speech of Federal Reserve Head
Despite the abundance of fundamental data of the past trading week, the main currency pairs continue to trade in rather narrow flat corridors. Thus, the US dollar/yen currency pair is trading above 150.00, from time to time testing the figure 149, buyers of the pound/US dollar pair do not give up trying to go above 1.2700, and the euro/US dollar pair has been trading between 1.0900-1.0800 for about three weeks. Apparently, investors are waiting for more specific signals from leading central banks to open new positions.
USD/JPY
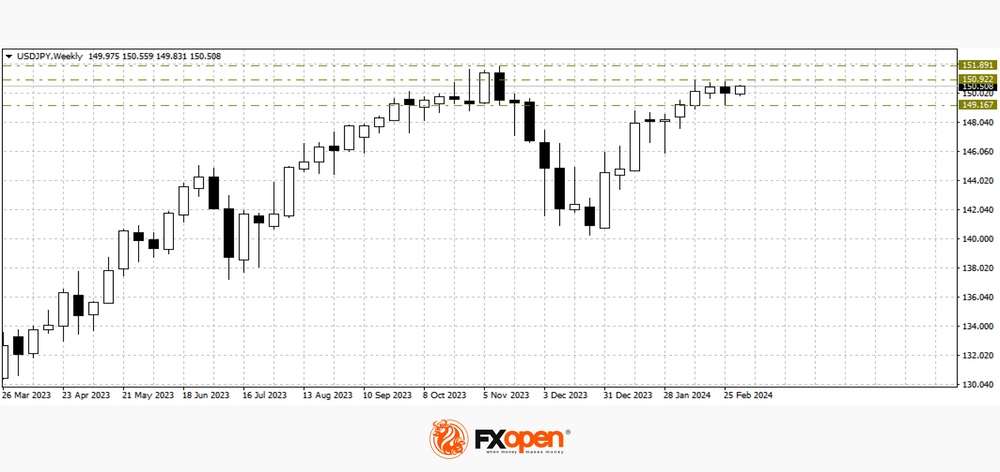
Last week, greenback buyers in the USD/JPY pair once again tried to test important resistance at 151.00. The attempt was unsuccessful and ended with a sharp rollback to 149.10, which allowed the formation of a reversal pattern to begin on the weekly timeframe. If on the USD/JPY chart in the coming trading sessions the level of 151.00 remains in resistance status, the price may test 149.00 again. If buyers manage to gain a foothold above 151.00, growth may resume towards last year's highs at 151.90.Today at 17:45 GMT+3, we are waiting for the publication of data on the business activity index (PMI) in the services sector for February. A little later, the Purchasing Managers' Index for the US non-manufacturing sector from ISM will be published for the same period.
Tomorrow at 18:00 GMT+3, Fed Chairman Jerome Powell is scheduled to speak.
VIEW FULL ANALYSIS VISIT - FXOpen Blog...
Disclaimer: This article represents the opinion of the Companies operating under the FXOpen brand only (excluding FXOpen EU). It is not to be construed as an offer, solicitation, or recommendation with respect to products and services provided by the Companies operating under the FXOpen brand, nor is it to be considered financial advice.
-
NASDAQ Rally Shows Tech Stocks Are Back in Focus - But for How Long?

The NASDAQ index, well known as a premier listing venue for North American technology companies across the entire spectrum from the Silicon Valley giants to recently listed newcomers, has been going from strength to strength during the beginning part of this year.
At the beginning of January, the NASDAQ was resting at a relatively low point in the mid-16,300 range and has since risen to 18,318.7 at the high points of the trading day in New York yesterday, according to FXOpen pricing.
This is a considerable increase, and apart from a few small dips along the way, it has been consistent for the majority of the first quarter of the year so far.
Yesterday's trading was of great interest to those with a keen penchant for US tech stocks, as the NASDAQ's high point of 18,318.7 represented an all-time record for the index, clearly demonstrating that these days, there is a clear distinction between enthusiasm among traders for NASDAQ-listed companies compared to two years ago when there was a sustained period of low value across NASDAQ listed stocks.
Those times are gone, and the halcyon days are back. However, the euphoria subsided slightly as the trading day came to a close yesterday during the US session, as the NASDAQ, despite a rallying group of technology stocks tied to the artificial intelligence boom keeping the values high, began to make a slight climbdown from its historic high.
Trading will begin today with the NASDAQ index standing at 18,129.1 according to the bottom of the candlestick on FXOpen charts, which is still high compared to the entire history of the NASDAQ index apart from the levels it reached during yesterday's trading.
Some of the contributors to NASDAQ's highs have been long-established computer technology giants which have been pioneering AI, an example being NVIDIA, a company traditionally synonymous with the manufacture of graphics cards, which had huge traction during the cryptocurrency mining boom last decade and sustained popularity among gamers around the world.
NVIDIA stock has boomed over the past month, with some sources quoting a 22.9% increase in stock value, therefore being a significant component within NASDAQ's listed giants, which is contributing to the index's recent resurgence.
As featured in the Top 5 Stocks for March 2024, Coinbase has been doing exceptionally well, a firm whose performance has also benefited the overall stature of the NASDAQ index within which it is a component.
VIEW FULL ANALYSIS VISIT - FXOpen Blog...
Disclaimer: This article represents the opinion of the Companies operating under the FXOpen brand only (excluding FXOpen EU). It is not to be construed as an offer, solicitation, or recommendation with respect to products and services provided by the Companies operating under the FXOpen brand, nor is it to be considered financial advice.
-
Market Analysis: EUR/USD Eyes More Gains, USD/CHF Could Rally
EUR/USD started a fresh increase above the 1.0828 resistance. USD/CHF declined and now struggling below the 0.8860 resistance.
Important Takeaways for EUR/USD and USD/CHF Analysis Today
· The Euro rallied after it broke the 1.0828 resistance against the US Dollar.· There is a connecting bullish trend line forming with support near 1.0845 on the hourly chart of EUR/USD at FXOpen.
· USD/CHF declined below the 0.8860 and 0.8850 support levels.
· There is a key contracting triangle forming with resistance near 0.8850 on the hourly chart at FXOpen.
EUR/USD Technical Analysis
On the hourly chart of EUR/USD at FXOpen, the pair started a fresh increase from the 1.0800 zone. The Euro cleared the 1.0828 resistance to move into a bullish zone against the US Dollar, as mentioned in the previous analysis.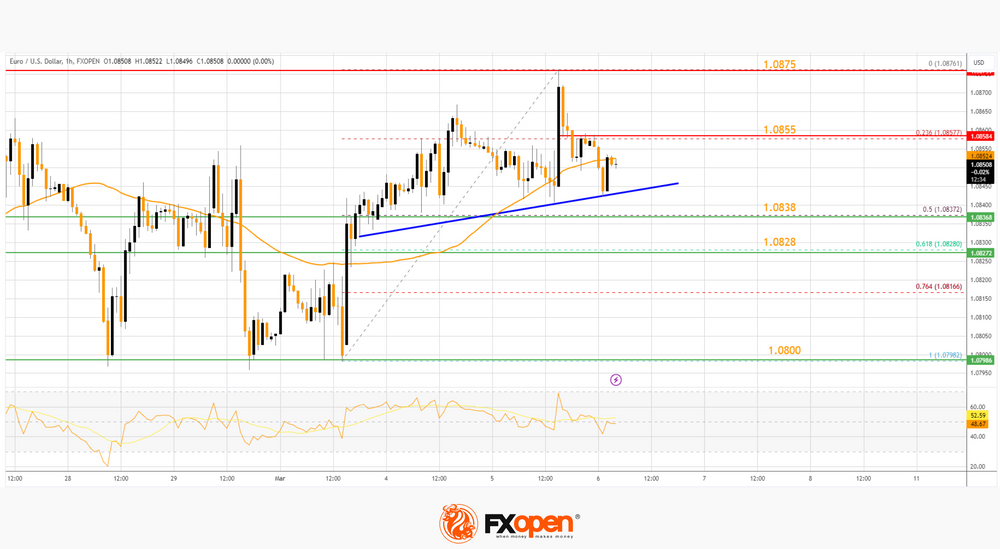
The bulls pushed the pair above the 50-hour simple moving average and 1.0855. Finally, the pair tested the 1.0875 resistance. A high was formed near 1.0876 and the pair is now consolidating gains. There was a move below the 23.6% Fib retracement level of the upward wave from the 1.0798 swing low to the 1.0876 high.
VIEW FULL ANALYSIS VISIT - FXOpen Blog...
Disclaimer: This article represents the opinion of the Companies operating under the FXOpen brand only (excluding FXOpen EU). It is not to be construed as an offer, solicitation, or recommendation with respect to products and services provided by the Companies operating under the FXOpen brand, nor is it to be considered financial advice.
-
After Updating the Historical High, the Price of Bitcoin Collapsed by 14%
Bitcoin's previous all-time high price, recorded on November 10, 2021, was around USD 68,900 per coin (depending on exchanges).
But yesterday, the price of Bitcoin exceeded 69k! However, the jubilation from the new historical peak quickly gave way to fear — as the BTC/USD rate began to fall rapidly. From peak A to low B – the price traveled a path of more than -14% in just 5 hours.
These events highlight 2 characteristic features of the cryptocurrency market:
→ Excessive volatility, which is not typical for the stock and foreign exchange markets. For comparison: on October 19, 1987 — Black Monday — the S&P 500 index fell by about 20.5%. After this incident, there were no days when the drop exceeded 14%.
→ Emotionality of the market and the importance of psychological levels. At these levels, the price of Bitcoin often makes false punctures. Yesterday, there were 2 such punctures: a false bullish puncture of the 2021 top, and a false bearish puncture of the round level of 60k dollars for Bitcoin.
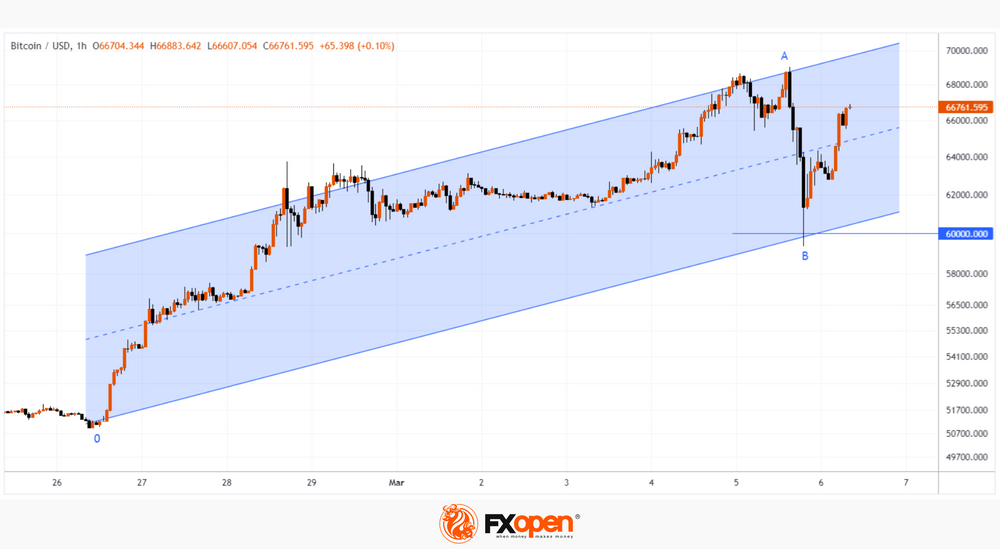
It is also worth noting that yesterday’s low was strengthened by support lines:
→ Fibo level 50% of the rally 0→A.
→ The lower border of the ascending channel (shown in blue).VIEW FULL ANALYSIS VISIT - FXOpen Blog...
Disclaimer: This article represents the opinion of the Companies operating under the FXOpen brand only (excluding FXOpen EU). It is not to be construed as an offer, solicitation, or recommendation with respect to products and services provided by the Companies operating under the FXOpen brand, nor is it to be considered financial advice.
Modify message -
TSLA Stock Price Falls Over 9% in Just 2 Days
The day before yesterday, trading in TSLA shares began at an opening price of USD 199.34; trading yesterday closed at a price of USD 180.51. The fall in TSLA shares led Musk to lose the title of the world's richest man to Jeff Bezos.
The main driver of the decline in the price of TSLA shares was news:
→ about the temporary shutdown of the Giga Berlin plant in Germany after an arson set by a group claiming that the company led by Elon Musk is devouring “land, resources, people”;
→ that deliveries of electric cars from the Shanghai plant have dropped to their lowest level in more than a year — which may indicate fierce competition with Chinese manufacturers.It also became known that Morgan Stanley analyst Adam Jonas is lowering his target price from USD 345 to USD 320 and predicting a decline in sales for FY24.
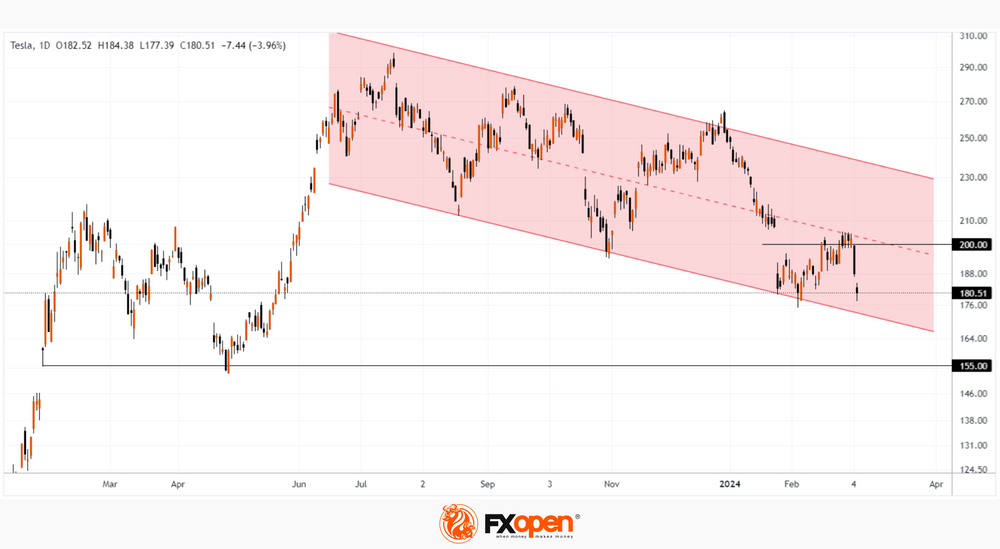
Technical analysis of the TSLA stock chart shows that:
→ The TSLA stock price is moving in a downward channel (shown in red), acting noticeably weaker than the broader market.
→ In March, the median line acted as resistance.
→ The price was unable to consolidate above the round level of USD 200 (in November last year it worked as support).VIEW FULL ANALYSIS VISIT - FXOpen Blog...
Disclaimer: This article represents the opinion of the Companies operating under the FXOpen brand only (excluding FXOpen EU). It is not to be construed as an offer, solicitation, or recommendation with respect to products and services provided by the Companies operating under the FXOpen brand, nor is it to be considered financial advice.
-
The Price of Gold XAU/USD Sets a Historical Record Exceeding $2160 per Ounce
The previous high was around USD 2,135, but gold rose above USD 2,160 an ounce this morning, reaching its highest level ever, as Treasury yields weakened on hopes that the US Federal Reserve will soon begin cutting interest rates.
In a speech yesterday, the Fed chief offered no clarity, saying it would likely be appropriate to ease policy restrictions "at some point this year."
Traders now see a 70% chance of a Fed rate cut in June.
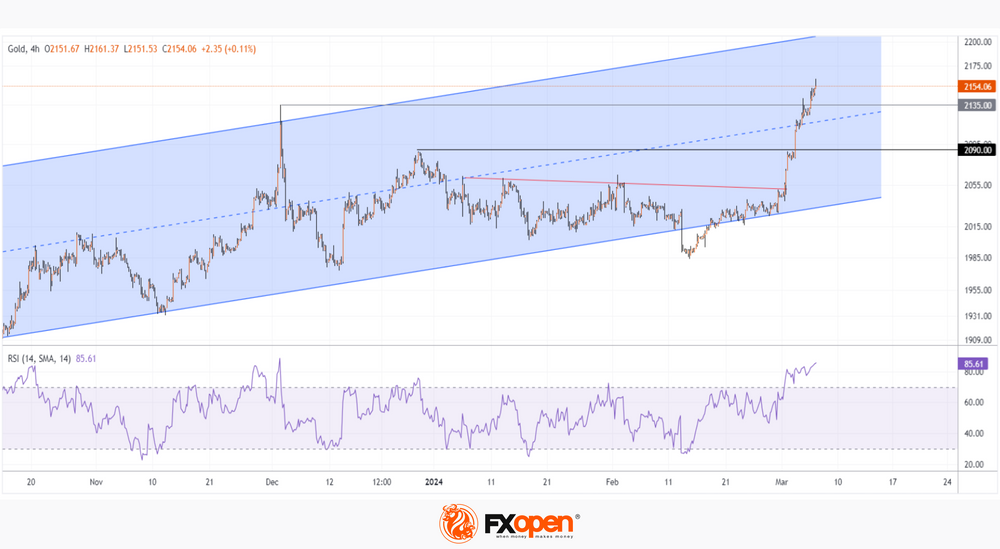
Technical analysis of the XAU/USD chart shows that:
→ the price of gold is in an ascending channel (shown in blue);
→ after a false breakout of its lower border, the price confidently overcame the downward trend line (shown in red) and resistance 2,090;
→ a strong upward impulse led to the RSI indicator entering the extreme overbought zone.Although the blue ascending channel leaves room for growth to its upper limit, the rise in the price of gold by more than 5% since the first days of March leaves the market vulnerable to a correction — for instance, to the median line of the ascending channel.
VIEW FULL ANALYSIS VISIT - FXOpen Blog...
Disclaimer: This article represents the opinion of the Companies operating under the FXOpen brand only (excluding FXOpen EU). It is not to be construed as an offer, solicitation, or recommendation with respect to products and services provided by the Companies operating under the FXOpen brand, nor is it to be considered financial advice.
-
USD/CAD Analysis: Canadian Dollar Strengthens after Bank of Canada Decision
The Bank of Canada has decided to keep interest rates at 5.0% for the fifth time in a row, it announced yesterday, as it continues to look for clearer signs that inflation is moving closer to the bank's 2% target before considering rate cuts.
According to Bank of Canada Governor Tiff Macklem:
→ the Bank is concerned that underlying inflationary pressures remain.
→ It is too early to ease restrictive policies. There is a clear consensus within the Board of Governors that the time has not come (for rate cuts).
→ We are now in a difficult phase of the monetary cycle.These hawkish statements contributed to the Canadian dollar strengthening against other currencies, in particular against the US dollar.
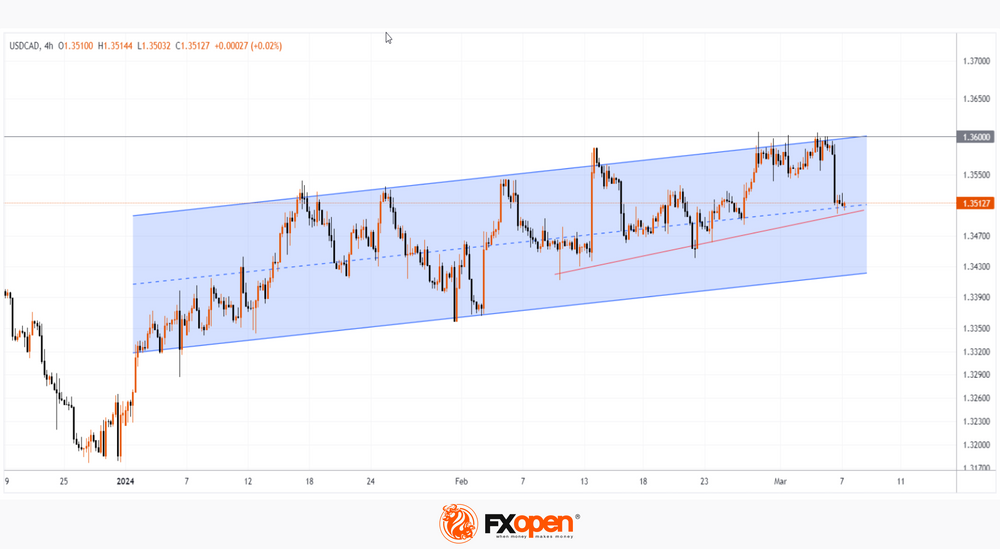
Technical analysis of the USD/CAD chart today shows that:
→ for most of 2024, the price moves within the channel shown in blue;
→ yesterday’s news lowered the price from its upper limit to the median;
→ the psychological level of 1.36 retained its role as resistance, although the bulls repeatedly tried to overcome it.If the bears maintain the initiative, the price of USD/CAD may fall below:
→ breaking through the median line of the channel;
→ breaking through the local trend line (shown by the orange line);
→ attempting to break through the psychological level of 1.35.In this scenario, the most obvious target for bears may be the lower boundary of the channel, with news about inflation and interest rates remaining the main drivers in the USD/CAD market. Today, by the way, at 16:15 GMT+3, the decision on interest rates from the ECB will become known — be prepared for surges in volatility.
VIEW FULL ANALYSIS VISIT - FXOpen Blog...
Disclaimer: This article represents the opinion of the Companies operating under the FXOpen brand only (excluding FXOpen EU). It is not to be construed as an offer, solicitation, or recommendation with respect to products and services provided by the Companies operating under the FXOpen brand, nor is it to be considered financial advice.
-
Market Analysis: AUD/USD and NZD/USD Start Fresh Rally
AUD/USD is gaining pace and recently cleared 0.6600. NZD/USD is also rising and could extend its increase above the 0.6200 resistance zone.
Important Takeaways for AUD/USD and NZD/USD Analysis Today
The Aussie Dollar is moving higher from the 0.6480 zone against the US Dollar.
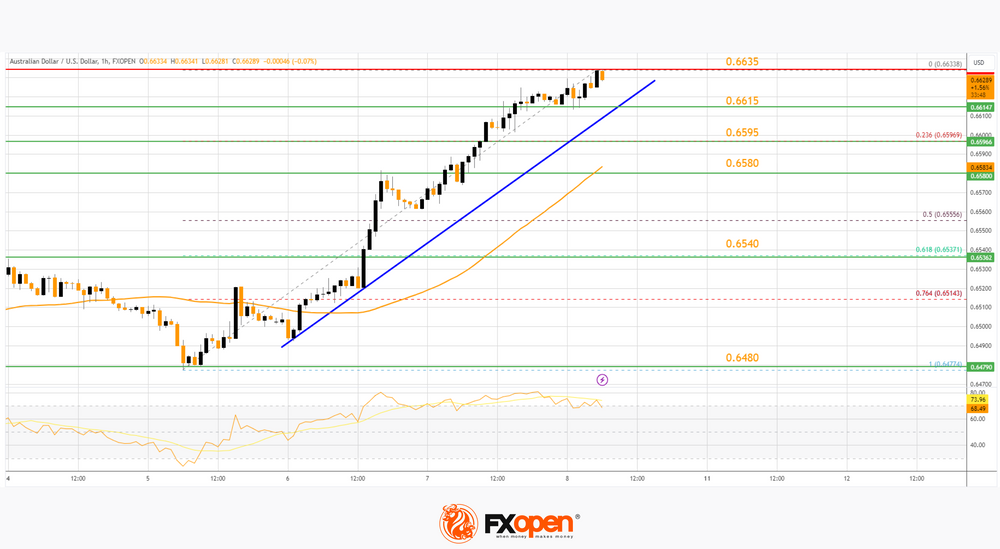
A connecting bullish trend line is forming with support at 0.6615 on the hourly chart of AUD/USD at FXOpen.
NZD/USD is gaining pace above the 0.6155 support.
A key bullish trend line is forming with support at 0.6170 on the hourly chart of NZD/USD at FXOpen.
AUD/USD Technical Analysis
On the hourly chart of AUD/USD at FXOpen, the pair formed a base above 0.6480, as discussed in the previous analysis. The Aussie Dollar gained strong bids and started a decent increase above the 0.6540 resistance against the US Dollar.The bulls pushed the pair above the 0.6580 resistance zone. There was a close above the 0.6600 resistance and the 50-hour simple moving average. Finally, the pair tested the 0.6635 zone. A high is formed at 0.6633 and the pair is now consolidating above 23.6% Fib retracement level of the upward move from the 0.6477 swing low to the 0.6633 high.
VIEW FULL ANALYSIS VISIT - FXOpen Blog...
Disclaimer: This article represents the opinion of the Companies operating under the FXOpen brand only (excluding FXOpen EU). It is not to be construed as an offer, solicitation, or recommendation with respect to products and services provided by the Companies operating under the FXOpen brand, nor is it to be considered financial advice.
-
EUR/USD Hits 8-week High
The euro is trading above USD 1.09, hitting its strongest point since mid-January on Friday, helped by news from both the US and Europe.
Friday's news showed that the US labor market is weakening:
→ The change in employment in the non-farm sector showed an increase in jobs = 275k for the month, although last month it was = +353k.
→ The unemployment rate rose to 3.9%, although it was 3.7% for 3 months.
News of a weakening labour market could put pressure on the Fed to ease monetary policy.Meanwhile in Europe, the ECB kept borrowing costs at a record high, citing significant progress in containing inflation, and revised its inflation expectations downward, forecasting price growth of 2.3% in 2024, and 1.9% in 2025. And during a press conference last Thursday, ECB President Lagarde told reporters that policymakers had not discussed rate cuts at that meeting.
Thus, there is reason to believe that the Fed will start lowering rates earlier (it started raising them earlier than the ECB). And this assumption is shared by many market participants, judging by the bullish dynamics in the EUR/USD market.
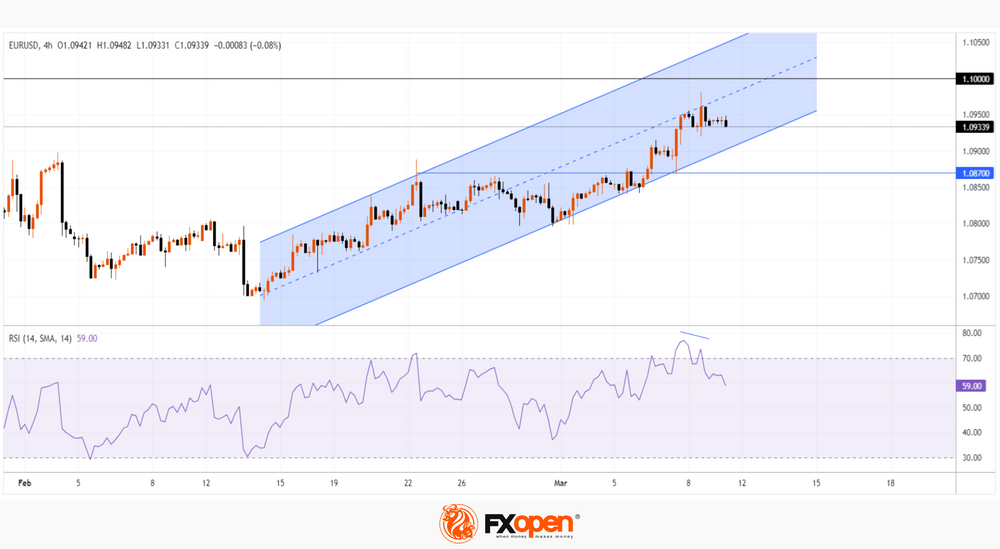
Today's chart shows:
→ the price of EUR/USD has been moving within an ascending channel (shown in blue) since mid-February. Moreover, it seems that the median line acts as resistance — Friday’s peak indicates this;
→ the price rose to the important psychological level of 1.1000 – it served as resistance in January;
→ the RSI indicator is in the overbought zone, forming a bearish divergence.VIEW FULL ANALYSIS VISIT - FXOpen Blog...
Disclaimer: This article represents the opinion of the Companies operating under the FXOpen brand only (excluding FXOpen EU). It is not to be construed as an offer, solicitation, or recommendation with respect to products and services provided by the Companies operating under the FXOpen brand, nor is it to be considered financial advice.
-
The rally is over! NASDAQ leads US stock market declines

The halcyon days of US tech stock rallies with increasing values of companies listed on the NASDAQ exchange, which have taken place alongside the increasing values of other North American indices, have ended abruptly.
The past few weeks have been of great interest, with the NASDAQ index leading the charge toward a seemingly unrelenting increase in value as confidence in large companies developing AI technology, such as NVIDIA, well known for its graphics cards and now highly engrossed in AI development, as well as strong performance from specialist American firms such as Broadcom and cloud computing giant Cloudstrike Holdings which have led the rally well into March.
As well as the NASDAQ index having tailed off, other US stock indices have experienced similar decrements.
The tables turned quite significantly at the end of last week; however, when the NASDAQ index began to reduce in value, the all-time highs of last week were not replicated this week.
On Friday, the NASDAQ index was trading at 18,273.8 according to FXOpen pricing; however, as market participants anticipate the opening of the US market today, the tech-friendly index is valued at 17,975.7 at the bottom of the candlestick in the pre-market opening hours.
In keeping with the nature of US tech stocks, volatility is once again a subject of discussion across mainstream reports and among analysts, especially given that one of the contingents of the NASDAQ index that was contributing to its rally, NVIDIA, has experienced a decline in stock value by 5.5%, according to some media reports, during the course of Friday last week after a substantial rally that has seen it gain approximately 80% year to date.
VIEW FULL ANALYSIS VISIT - FXOpen Blog...
Disclaimer: This article represents the opinion of the Companies operating under the FXOpen brand only (excluding FXOpen EU). It is not to be construed as an offer, solicitation, or recommendation with respect to products and services provided by the Companies operating under the FXOpen brand, nor is it to be considered financial advice.
-
US Dollar Ended the Week under Pressure
The February labour market report was published in the United States. The number of new jobs created by the national economy outside the agricultural sector increased by 275.0k in January after an increase of 229.0k a month earlier, while experts expected an increase of 200.0k. It should also be noted that the January figure was revised from the previous estimate of 353.0k jobs. The average hourly wage in annual terms adjusted from 4.4% to 4.3%, and in monthly terms, from 0.5% to 0.1%. At the same time, the unemployment rate in February increased sharply from 3.7% to 3.9%.
EUR/USD
The EUR/USD pair shows mixed dynamics, remaining close to 1.0940. Immediate resistance can be seen at 1.0980, a break higher could trigger a rise towards 1.1100. On the downside, immediate support is seen at 1.0887, a break below could take the pair towards 1.0842.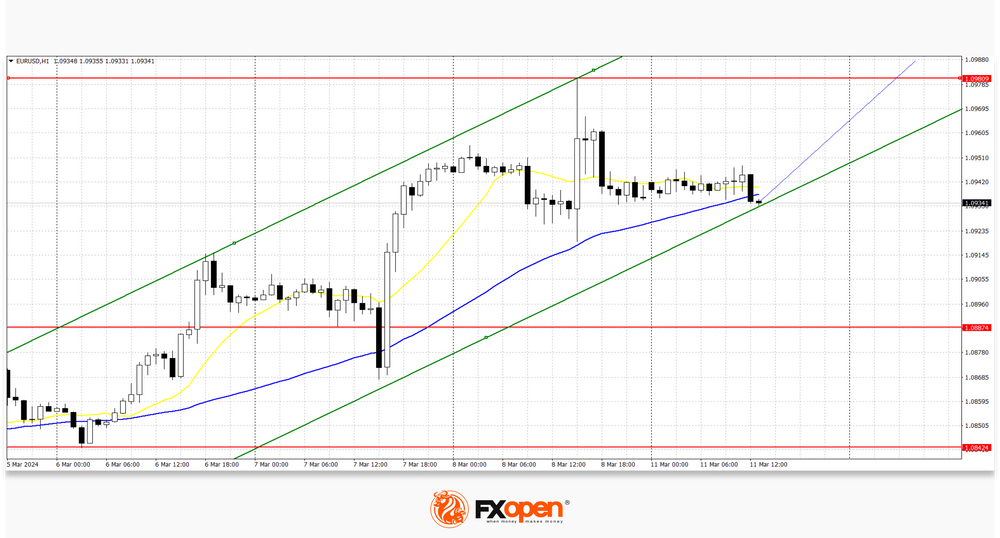
Market activity remains subdued as investors analyse macroeconomic data released last week. On Friday, March 8, trading participants drew attention to the decline in the annual dynamics of industrial production in Germany in January by 5.5% after -3.5% in the previous month, and in monthly terms the figure strengthened by 1.0% after a reduction of 2 .0% in December against a forecast of 0.6%, which allows the German economy to emerge from recession in the near future. The German producer price index added 0.2% monthly after -0.8% in December, and slowed down by 4.4% year-on-year after -5.1%, while markets were expecting -6.6%. Trading participants also assessed statistics on the eurozone GDP product for the fourth quarter of 2023: on a quarterly basis, the figure remained at 0.0%, and on an annual basis it increased by 0.1%, which coincided with expectations.
VIEW FULL ANALYSIS VISIT - FXOpen Blog...
Disclaimer: This article represents the opinion of the Companies operating under the FXOpen brand only (excluding FXOpen EU). It is not to be construed as an offer, solicitation, or recommendation with respect to products and services provided by the Companies operating under the FXOpen brand, nor is it to be considered financial advice.
-
A Weak Dollar Is the Driver of Price Records for NASDAQ-100, BTC/USD, XAU/USD
Financial market participants expect an easing of the Fed's monetary policy. The prospect of lower rates puts pressure on the value of the dollar, which in turn pushes up dollar-denominated assets. This contributed to the setting of record highs:
→ The price of BTC/USD exceeded 70k dollars per bitcoin
→ The price of XAU/USD exceeded USD 2,200 per ounce of gold
→ The NASDAQ-100 index reached 18,400 points.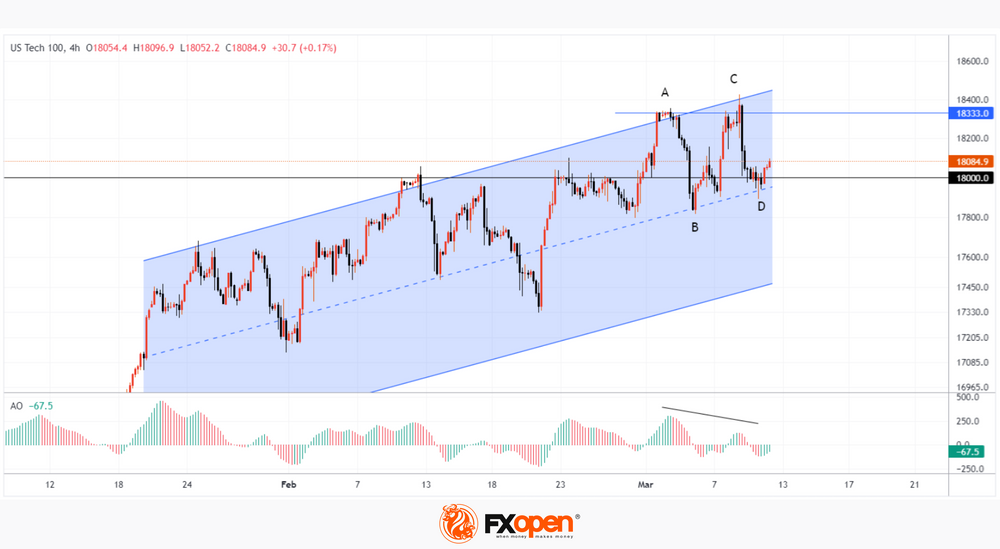
But are markets too optimistic? Let's see what the technical analysis of the NASDAQ-100 chart shows today:→ The price is in an uptrend (shown in blue), which has been in effect since the beginning of the year. The price is in the upper half, which may indicate the strength of demand.
→ Top C only slightly exceeded the level of the previous top A. It is not surprising that a bearish divergence has formed on the oscillators — Awesome Osc among them. Buyers who entered long positions at the breakout of top A found themselves in a trap. Sellers who held stops above A lost their positions.Pay attention to the nature of the NASDAQ-100 price movement from tops to local lows A→B and C→D. Each time, the bears were able to quickly lower the price as soon as it exceeded the 18.333 level. This indicates that sellers are active — perhaps they are taking profits after the rally since the beginning of the year.
VIEW FULL ANALYSIS VISIT - FXOpen Blog...
Disclaimer: This article represents the opinion of the Companies operating under the FXOpen brand only (excluding FXOpen EU). It is not to be construed as an offer, solicitation, or recommendation with respect to products and services provided by the Companies operating under the FXOpen brand, nor is it to be considered financial advice.
-
Australian Dollar Volatility Ends in Lull Ahead Of US Data
The Australian Dollar has recently been displaying signs of volatility, with its price varying considerably against the US Dollar over the past few months.
From a low point in October last year, the AUDUSD pair went on a sudden rally, which lasted until December before beginning to fall flat during the course of January. As February drew to a close, the AUDUSD pair began to rise in value again, reaching 0.66251 on March 4, according to FXOpen charts.
Over the past week, the Australian Dollar has been a bit dormant in its movements against the US Dollar; however, this morning's trading session in Australia and across the Asian market session began to demonstrate that some renewed interest is beginning to be shown in the Australian Dollar as the Australian economy begins to look a bit stronger.
This morning as the European markets begin to open, activity from the Australian market is being analysed and one matter of interest is that the Australian S&P index along with the ASX 200 which is an index featuring 200 well capitalised stocks on Australia's ASX exchange, showed improvement over previous performances which is being mooted as a potential strengthening factor for the Australian Dollar.
Today in Australia, financial services executives have held meetings to discuss the GDP within Australia for the fourth quarter of 2023, with nothing out of the ordinary having surfaced and data in line with expectation; however, there is anticipation regarding the forthcoming monetary policy announcements from the US Federal Reserve which may affect the value of the AUDUSD, and forthcoming CPI data in the United States for February looks set to meet expectations at 3.1, identical to that for January.
Speculation has begun to arise once again relating to interest rate reductions in the United States, with some reports this week anticipating that the Federal Reserve will begin to reduce interest rates in the United States in June this year.
This is being met with mixed views because the previous speculation, which was widespread and very high profile and stated that the monetary policy in the United States would be to begin reducing interest rates in the Spring, was incorrect as the Federal Reserve instead maintained rates at the current status quo. Given that CPI data in the US is not decreasing month on month and the Federal Reserve has postponed interest rate decreases so far because it is committed to reaching the sustainable 2% inflation rate, the jury is still out.
VIEW FULL ANALYSIS VISIT - FXOpen Blog...
Disclaimer: This article represents the opinion of the Companies operating under the FXOpen brand only (excluding FXOpen EU). It is not to be construed as an offer, solicitation, or recommendation with respect to products and services provided by the Companies operating under the FXOpen brand, nor is it to be considered financial advice.
-
The US Currency Is Consolidating ahead of the Release of Inflation Data
A rather weak US employment report published last week contributed to the US dollar's decline in almost all areas. Thus, the USD/JPY pair lost more than 150 pp in just a couple of hours, the pound/US dollar pair tested important resistance at 1.2900, and euro/US dollar buyers managed to strengthen above 1.0900.
USD/JPY
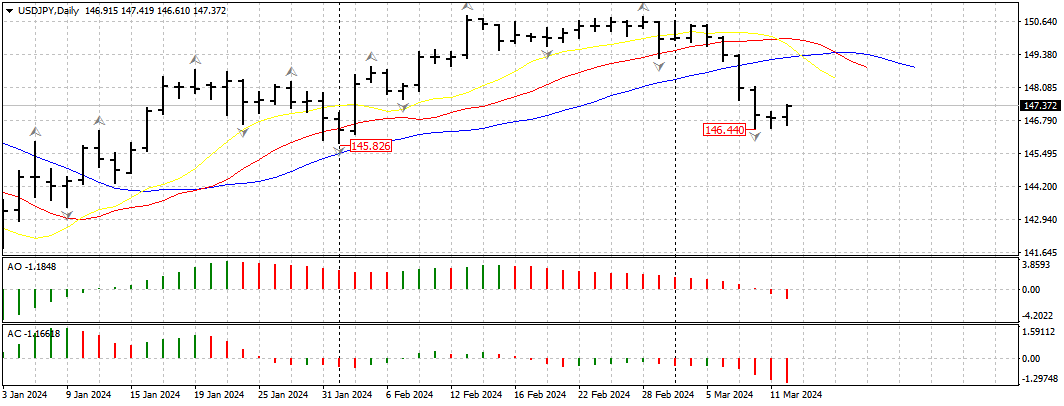
The weak fundamentals from the US are bolstering investor confidence that the Fed will begin cutting interest rates later this year. And although recent statements by the head of the American regulator, Jerome Powell, can hardly be called dovish, market participants prefer short-term sales of greenbacks.The USD/JPY currency pair fell to 146.50 at the end of last week. Yesterday, buyers of the pair managed to return the price above 147.00, but the full development of an upward correction has not yet been observed. If the pair manages to consolidate above 148.00, the price may test resistance at the alligator lines on the weekly timeframe near the range of 149.50-149.00. An update to the recent low on the USD/JPY chart could trigger a collapse to the extremes of the current year at 146.00-145.80.
Today's news on the basic US consumer price index for February will be important for the pair's pricing.
GBP/USD
The pound/US dollar currency pair, after strengthening to 1.2900, rolled back a little and is consolidating in a small 100-point corridor. If the pair’s buyers manage to resume the upward movement, the price may strengthen to last year’s extremes at 1.3140-1.3100. We can consider the cancellation of the upward scenario on the GBP/USD chart after a breakdown downward to 1.2600.VIEW FULL ANALYSIS VISIT - FXOpen Blog...
Disclaimer: This article represents the opinion of the Companies operating under the FXOpen brand only (excluding FXOpen EU). It is not to be construed as an offer, solicitation, or recommendation with respect to products and services provided by the Companies operating under the FXOpen brand, nor is it to be considered financial advice.
-
Market Analysis: GBP/USD Recovers While EUR/GBP Aims More Upsides
GBP/USD is attempting a fresh increase from the 1.2745 zone. EUR/GBP is gaining pace and might extend its rally above the 0.8550 zone.
Important Takeaways for GBP/USD and EUR/GBP Analysis Today
· The British Pound is attempting a recovery above the 1.2780 zone against the US Dollar.· There was a break above a key bearish trend line with resistance at 1.2790 on the hourly chart of GBP/USD at FXOpen.
· EUR/GBP started a fresh increase above the 0.8535 resistance zone.
· There is a major bullish trend line forming with support near 0.8535 on the hourly chart at FXOpen.
GBP/USD Technical Analysis
On the hourly chart of GBP/USD at FXOpen, the pair started a fresh decline from the 1.2890 zone. The British Pound traded below the 1.2820 zone against the US Dollar.A low was formed near 1.2746 and the pair is now attempting a recovery wave. There was a break above the 23.6% Fib retracement level of the downward move from the 1.2893 swing high to the 1.2746 low.
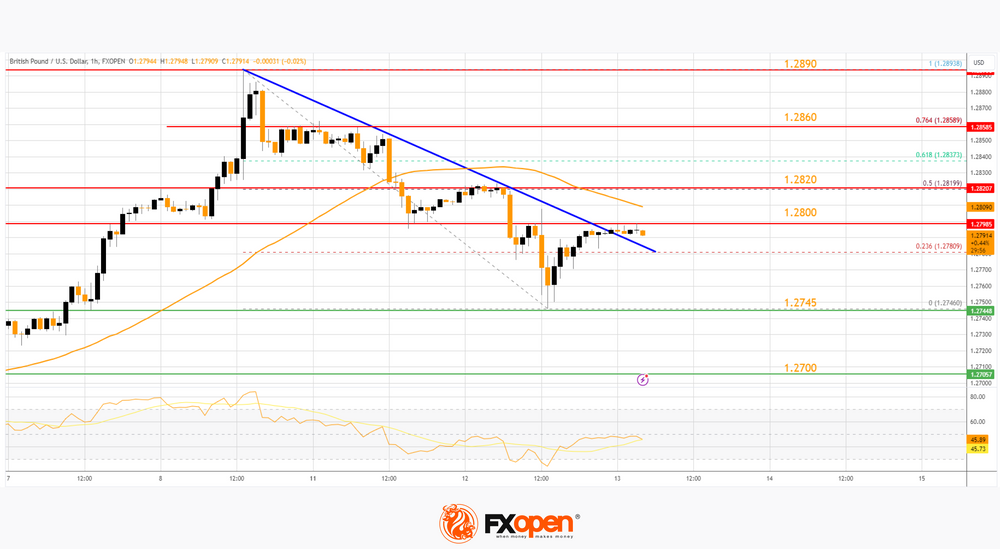
There was a break above a key bearish trend line with resistance at 1.2790, but the pair is still below the 50-hour simple moving average. On the upside, the GBP/USD chart indicates that the pair is facing resistance near 1.2800.
The next major resistance is near the 1.2820 level or the 50% Fib retracement level of the downward move from the 1.2893 swing high to the 1.2746 low. If the RSI moves above 50 and the pair climbs above 1.2820, there could be another rally. In the stated case, the pair could rise toward the 1.2890 level or even 1.2920.
On the downside, there is a major support forming near 1.2745. If there is a downside break below the 1.2745 support, the pair could accelerate lower. The next major support is near the 1.2700 zone, below which the pair could test 1.2665. Any more losses could lead the pair toward the 1.2550 support.
VIEW FULL ANALYSIS VISIT - FXOpen Blog...
Disclaimer: This article represents the opinion of the Companies operating under the FXOpen brand only (excluding FXOpen EU). It is not to be construed as an offer, solicitation, or recommendation with respect to products and services provided by the Companies operating under the FXOpen brand, nor is it to be considered financial advice.